Project One - Cities Rediscovering Themselves: The Aftermath of Local Law 18 in New York City's Airbnb Market Across the Boroughs
Introduction
One of the defining features of housing throughout the 2010s was the rise of short-term homestay platforms such as Airbnb, Booking.com, and VRBO. Giving people the opportunity to temporarily rent out spaces in their house to travelers has spurred an industry in excess of $15 billion, with that figure only expected to nearly quadruple in the next decade [1].
With so many financial resources at stake, governments have taken proactive measures to maintain the stability of their housing markets and prevent the price gouging frequently associated with an influx of short-term homestays at the expense of viable, long-term housing for residents. No city has perhaps enacted for aggressive measures to achieve these ends than New York City, whose Local Law 18 requires all short-term renters (short-term here defined to any stay 30 days or less) to be registered with the city—prohibiting transactions from renters that do not comply—and any visits that fall below this threshold are required to have the host remain as an occupant alongside the visitor through the duration of their stay. The repercussions of such legislative actions have been profound, and there is already a wealth of research that demonstrates the effects of such laws have fundamentally altered the duration of stay makeup across the city and have funneled money away from individual-run homestay services to hotels run by massive conglomerations (the ethicality of this switch is up to the reader) [2], [3].
However, an in-depth look into a city removed more than a year from these changes has been much less prevalent. The characteristics of New York’s boroughs—The Bronx, Brooklyn, Manhattan, Queens, and Staten Island—and the vastly different socioeconomic, racial, and cultural values that are intrinsic to each open the question on who are bearing the cost of these changes the most and who remain largely unaffected? Furthermore, what is the current homestay market in each of the boroughs; what similarities tie the industry together and what differences factionalize it? To further clarify, the question that I hope to find out are the geographic spatially of Airbnb listings but also how different types of listings are distributed across the city. These are the questions, among others, that this project seeks to answer.
Where did this data even come from?
There is an awesome site called Inside AirBnb that has Airbnb data for a wide variety of cities across the globe; this is where I accessed any data from February 2024 - November 2024. The 2023 dataset is unfortunately limited behind a paid data request, but luckily someone made it available on Kaggle, along with the 2020 dataset (yay!).
The features of this dataset is extensive, and an entire data dictionary delves into each attribute. However, both datasets include:
- The price of the AirBnb when the data was taken
- The neighborhood the AirBnb is located in
- The latitude and longtitude (approximate) of the hosting site
- The room type that is being offered
- The minimum and maximum nights a host can rent out
- The number of days the property is available for throughout the year
The 2024 data has quite a few more features, such as the host acceptance rate, whether they are a superhost (own a variety of properties across the area), and detailed information about the property about the number of beds within the building and bathrooms. Some of this data can be a bit intrusive, such a host profile picture and description, however, I did not use this information within my analysis.
If you’d prefer to download this notebook, just press here.
Step One: Pre-Processing our data!
Before we can do any sort of modeling, we have to load in our dependencies. Just for reference, here all the packages I utilized:
import pandas as pd
import plotly.express as px
import plotly.offline as pyo
import seaborn as sns
import plotly.graph_objects as go
import numpy as np
from pandas.api.types import is_numeric_dtype
from great_tables import GT, md, html, system_fonts, style, loc
Now we can load in our dataframes (in case you’re interested, you can find the files here for July 2023 and here for November 2024.
nov_listings: pd.DataFrame = pd.read_csv('./datasets/new_york_listings.csv')
jul_23_listings: pd.DataFrame = pd.read_csv('./datasets/NYC-Airbnb-2023.csv')
We can take a peek at each table:
November 2024 Data: nov_listings
| id | listing_url | scrape_id | last_scraped | source | name | description | neighborhood_overview | picture_url | host_id | ... | review_scores_communication | review_scores_location | review_scores_value | license | instant_bookable | calculated_host_listings_count | calculated_host_listings_count_entire_homes | calculated_host_listings_count_private_rooms | calculated_host_listings_count_shared_rooms | reviews_per_month | |
|---|---|---|---|---|---|---|---|---|---|---|---|---|---|---|---|---|---|---|---|---|---|
| 0 | 2595 | https://www.airbnb.com/rooms/2595 | 20241104040953 | 2024-11-04 | city scrape | Skylit Midtown Castle Sanctuary | Beautiful, spacious skylit studio in the heart... | Centrally located in the heart of Manhattan ju... | https://a0.muscache.com/pictures/miso/Hosting-... | 2845 | ... | 4.8 | 4.81 | 4.40 | NaN | f | 3 | 3 | 0 | 0 | 0.27 |
| 1 | 6848 | https://www.airbnb.com/rooms/6848 | 20241104040953 | 2024-11-04 | city scrape | Only 2 stops to Manhattan studio | Comfortable studio apartment with super comfor... | NaN | https://a0.muscache.com/pictures/e4f031a7-f146... | 15991 | ... | 4.8 | 4.69 | 4.58 | NaN | f | 1 | 1 | 0 | 0 | 1.04 |
| 2 | 6872 | https://www.airbnb.com/rooms/6872 | 20241104040953 | 2024-11-04 | city scrape | Uptown Sanctuary w/ Private Bath (Month to Month) | This charming distancing-friendly month-to-mon... | This sweet Harlem sanctuary is a 10-20 minute ... | https://a0.muscache.com/pictures/miso/Hosting-... | 16104 | ... | 5.0 | 5.00 | 5.00 | NaN | f | 2 | 0 | 2 | 0 | 0.03 |
3 rows × 75 columns
July 2023 Data: jul_23_listings
| id | name | host_id | host_name | neighbourhood_group | neighbourhood | latitude | longitude | room_type | price | minimum_nights | number_of_reviews | last_review | reviews_per_month | calculated_host_listings_count | availability_365 | number_of_reviews_ltm | license | |
|---|---|---|---|---|---|---|---|---|---|---|---|---|---|---|---|---|---|---|
| 0 | 2595 | Skylit Midtown Castle | 2845 | Jennifer | Manhattan | Midtown | 40.75356 | -73.98559 | Entire home/apt | 150 | 30 | 49 | 2022-06-21 | 0.30 | 3 | 314 | 1 | NaN |
| 1 | 5121 | BlissArtsSpace! | 7356 | Garon | Brooklyn | Bedford-Stuyvesant | 40.68535 | -73.95512 | Private room | 60 | 30 | 50 | 2019-12-02 | 0.30 | 2 | 365 | 0 | NaN |
| 2 | 5203 | Cozy Clean Guest Room - Family Apt | 7490 | MaryEllen | Manhattan | Upper West Side | 40.80380 | -73.96751 | Private room | 75 | 2 | 118 | 2017-07-21 | 0.72 | 1 | 0 | 0 | NaN |
3 rows × 16 columns
Now with everything loaded, we can begin pre-processing our data. I start by removing some of the weird whitespace and capitalization that might be present throughout the file, along with removing the dollar sign from the price column (I do this for both datasets, but for brevity, I only show the code of nov_listings):
nov_listings.columns = np.vectorize(lambda x: x.strip().lower())(nov_listings.columns)

nov_listings['price'] = nov_listings["price"].apply(
    lambda x: float(x.replace('$', '').replace(',','') if isinstance(x, str) else x)
    )
Then we can drop the columns we will definitely know we won’t use throughout the visualization and analysis process.
nov_listings.drop(
    columns=['picture_url',
             'host_url',
             'neighbourhood', #Not really the neighborhood
             'host_thumbnail_url',
             'host_picture_url',
             'host_has_profile_pic',
             'host_identity_verified',
             'license',
             ],
    inplace = True
)
Now we can begin moving some of the missing values if we need it. I start with a basic print statement to just see how bad it really is:
print(f"""The number of NaN values per column in nov_listings: \n
{nov_listings.isna().sum().sort_values(ascending=False)[:11]}'
    """
    )
print(f"""
    'The number of NaN values per column in jul_23_listings: \n
      {jul_23_listings.isna().sum().sort_values(ascending=False)}
    """
    )
   The number of NaN values per column in nov_listings:

    neighborhood_overview    16974
host_about               16224
host_response_time       15001
host_response_rate       15001
host_acceptance_rate     14983
last_review              11560
first_review             11560
host_location             7999
host_neighbourhood        7503
has_availability          5367
description               1044
dtype: int64'


    'The number of NaN values per column in jul_23_listings:

      last_review                       10304
reviews_per_month                 10304
name                                 12
host_name                             5
neighbourhood_group                   0
neighbourhood                         0
id                                    0
host_id                               0
longitude                             0
latitude                              0
room_type                             0
price                                 0
number_of_reviews                     0
minimum_nights                        0
calculated_host_listings_count        0
availability_365                      0
dtype: int64
As useful as raw values may be, they don’t do a lot in terms of telling us which columns we should target in large datasets, especially those with a large number of rows. So, I created a quick table that shows us the percentage of each column that is missing (and used the great_tables module to make it look nice because why not?).
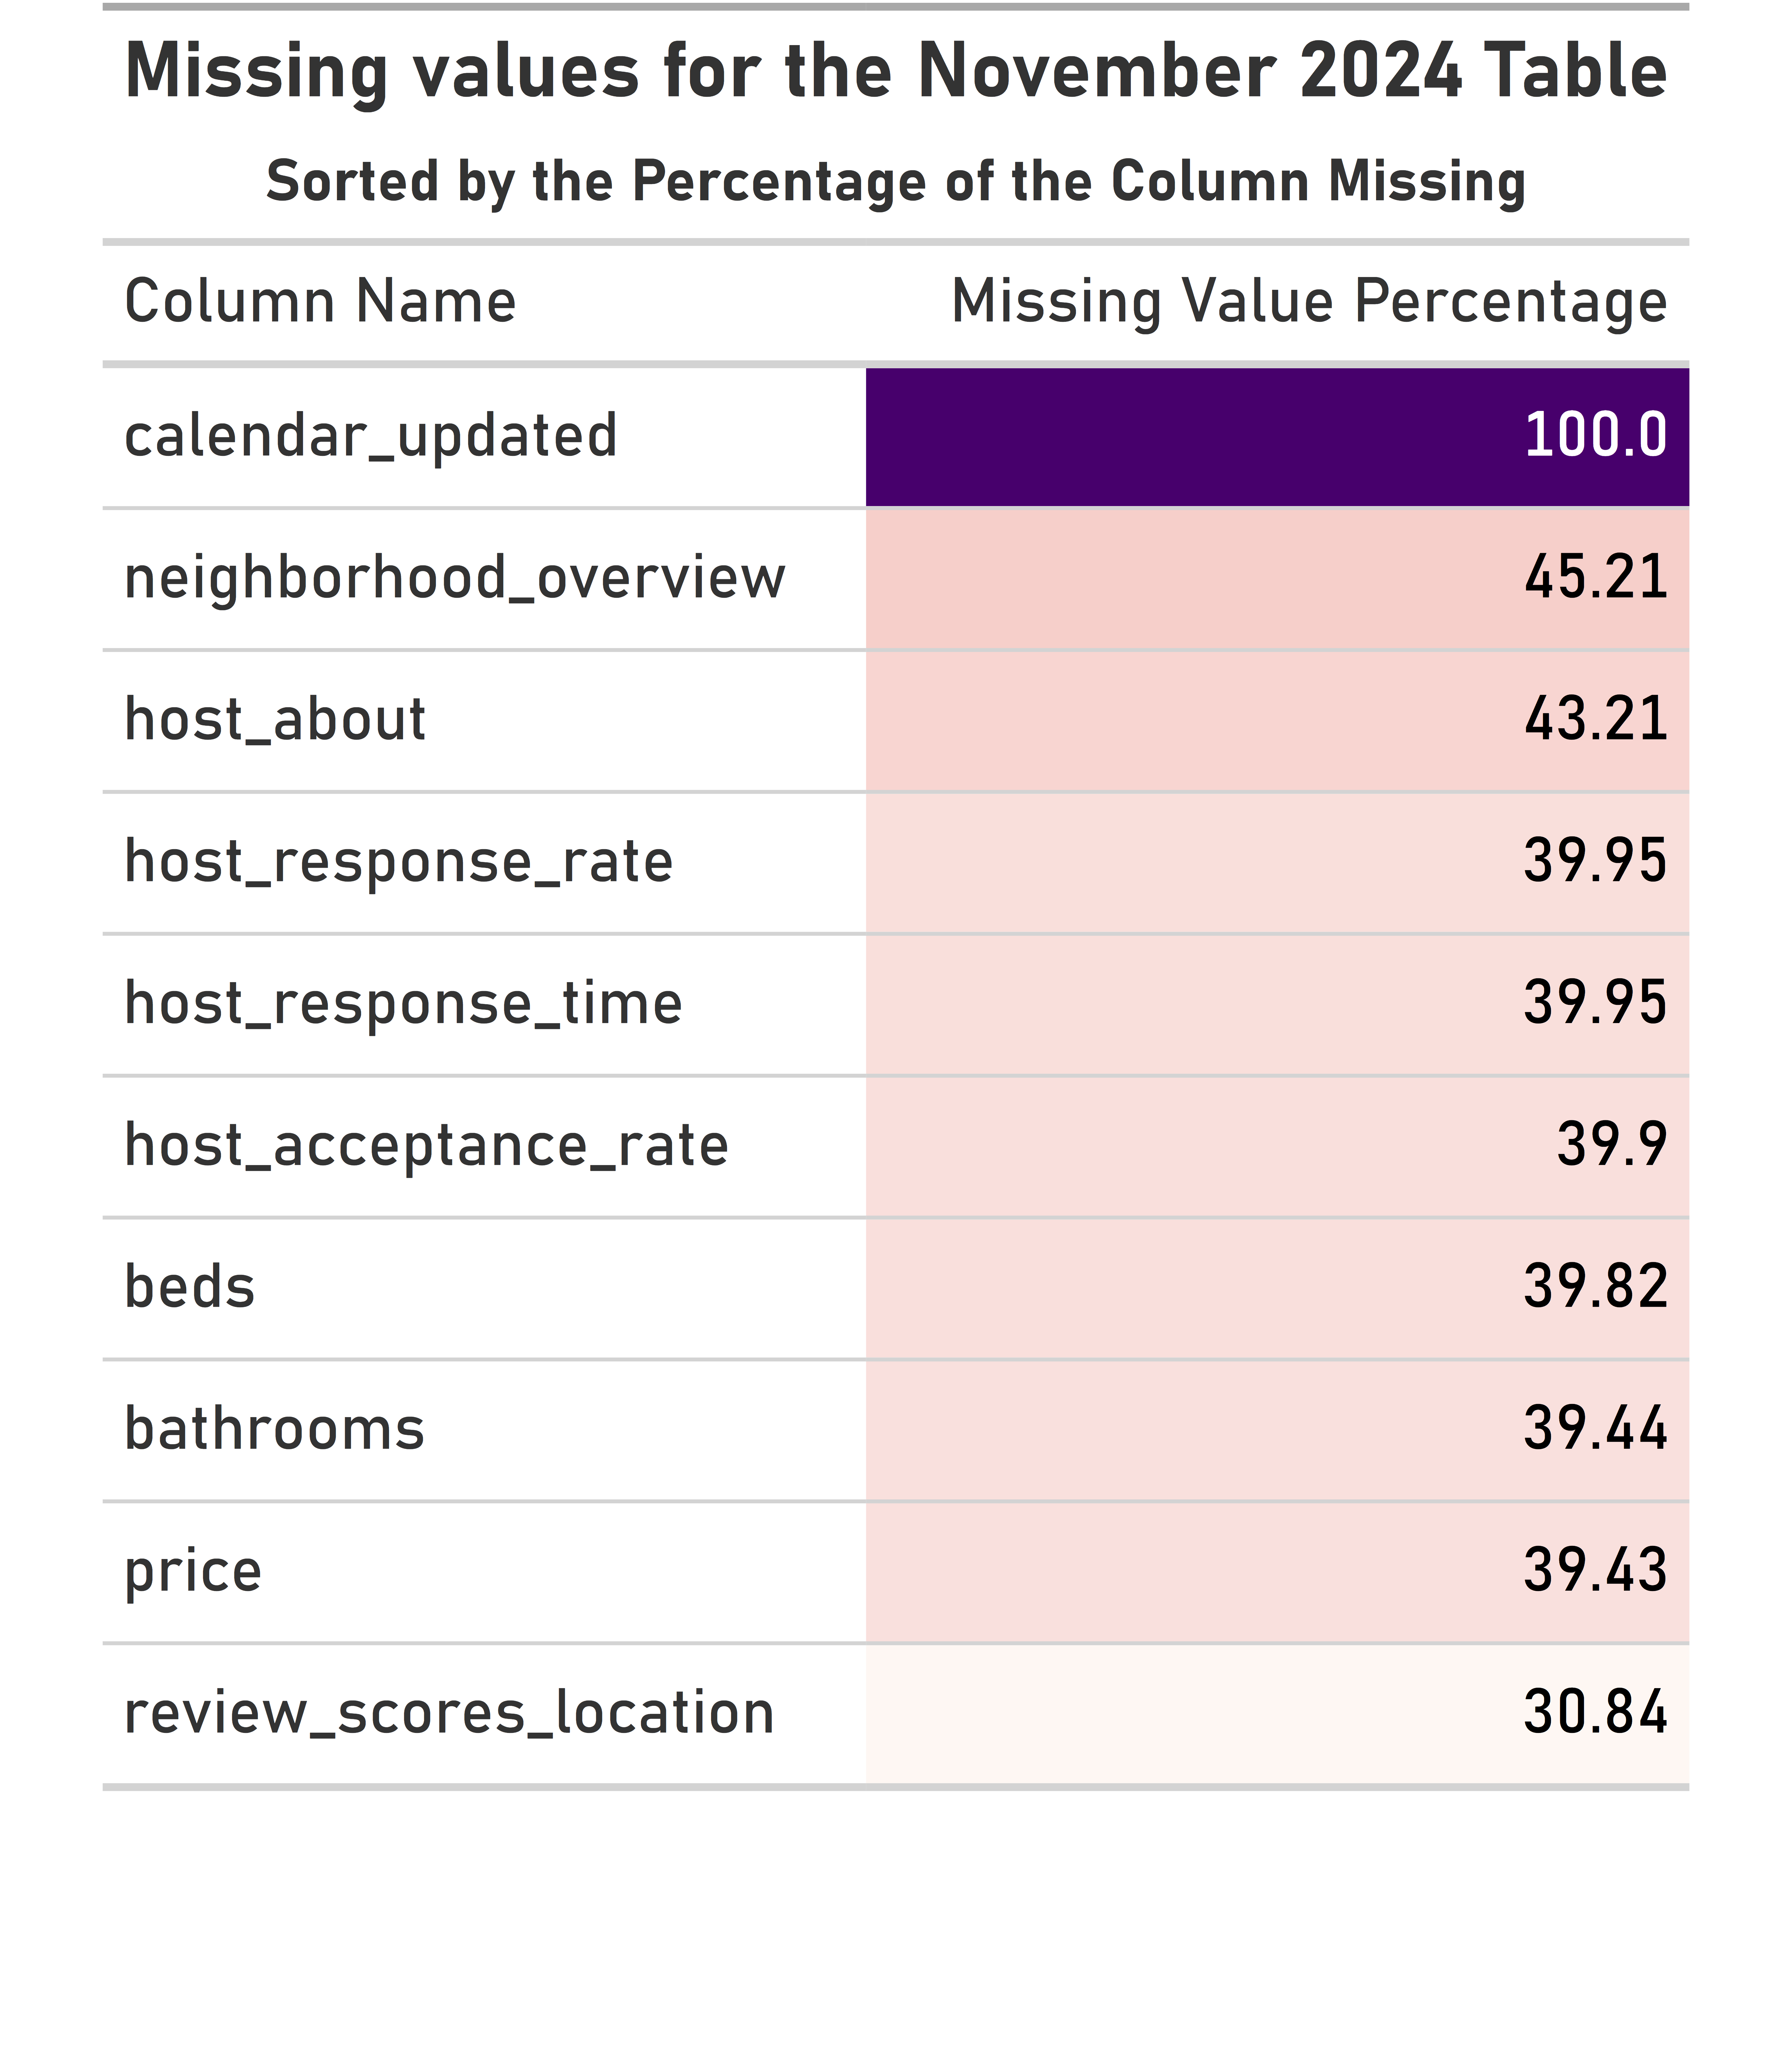
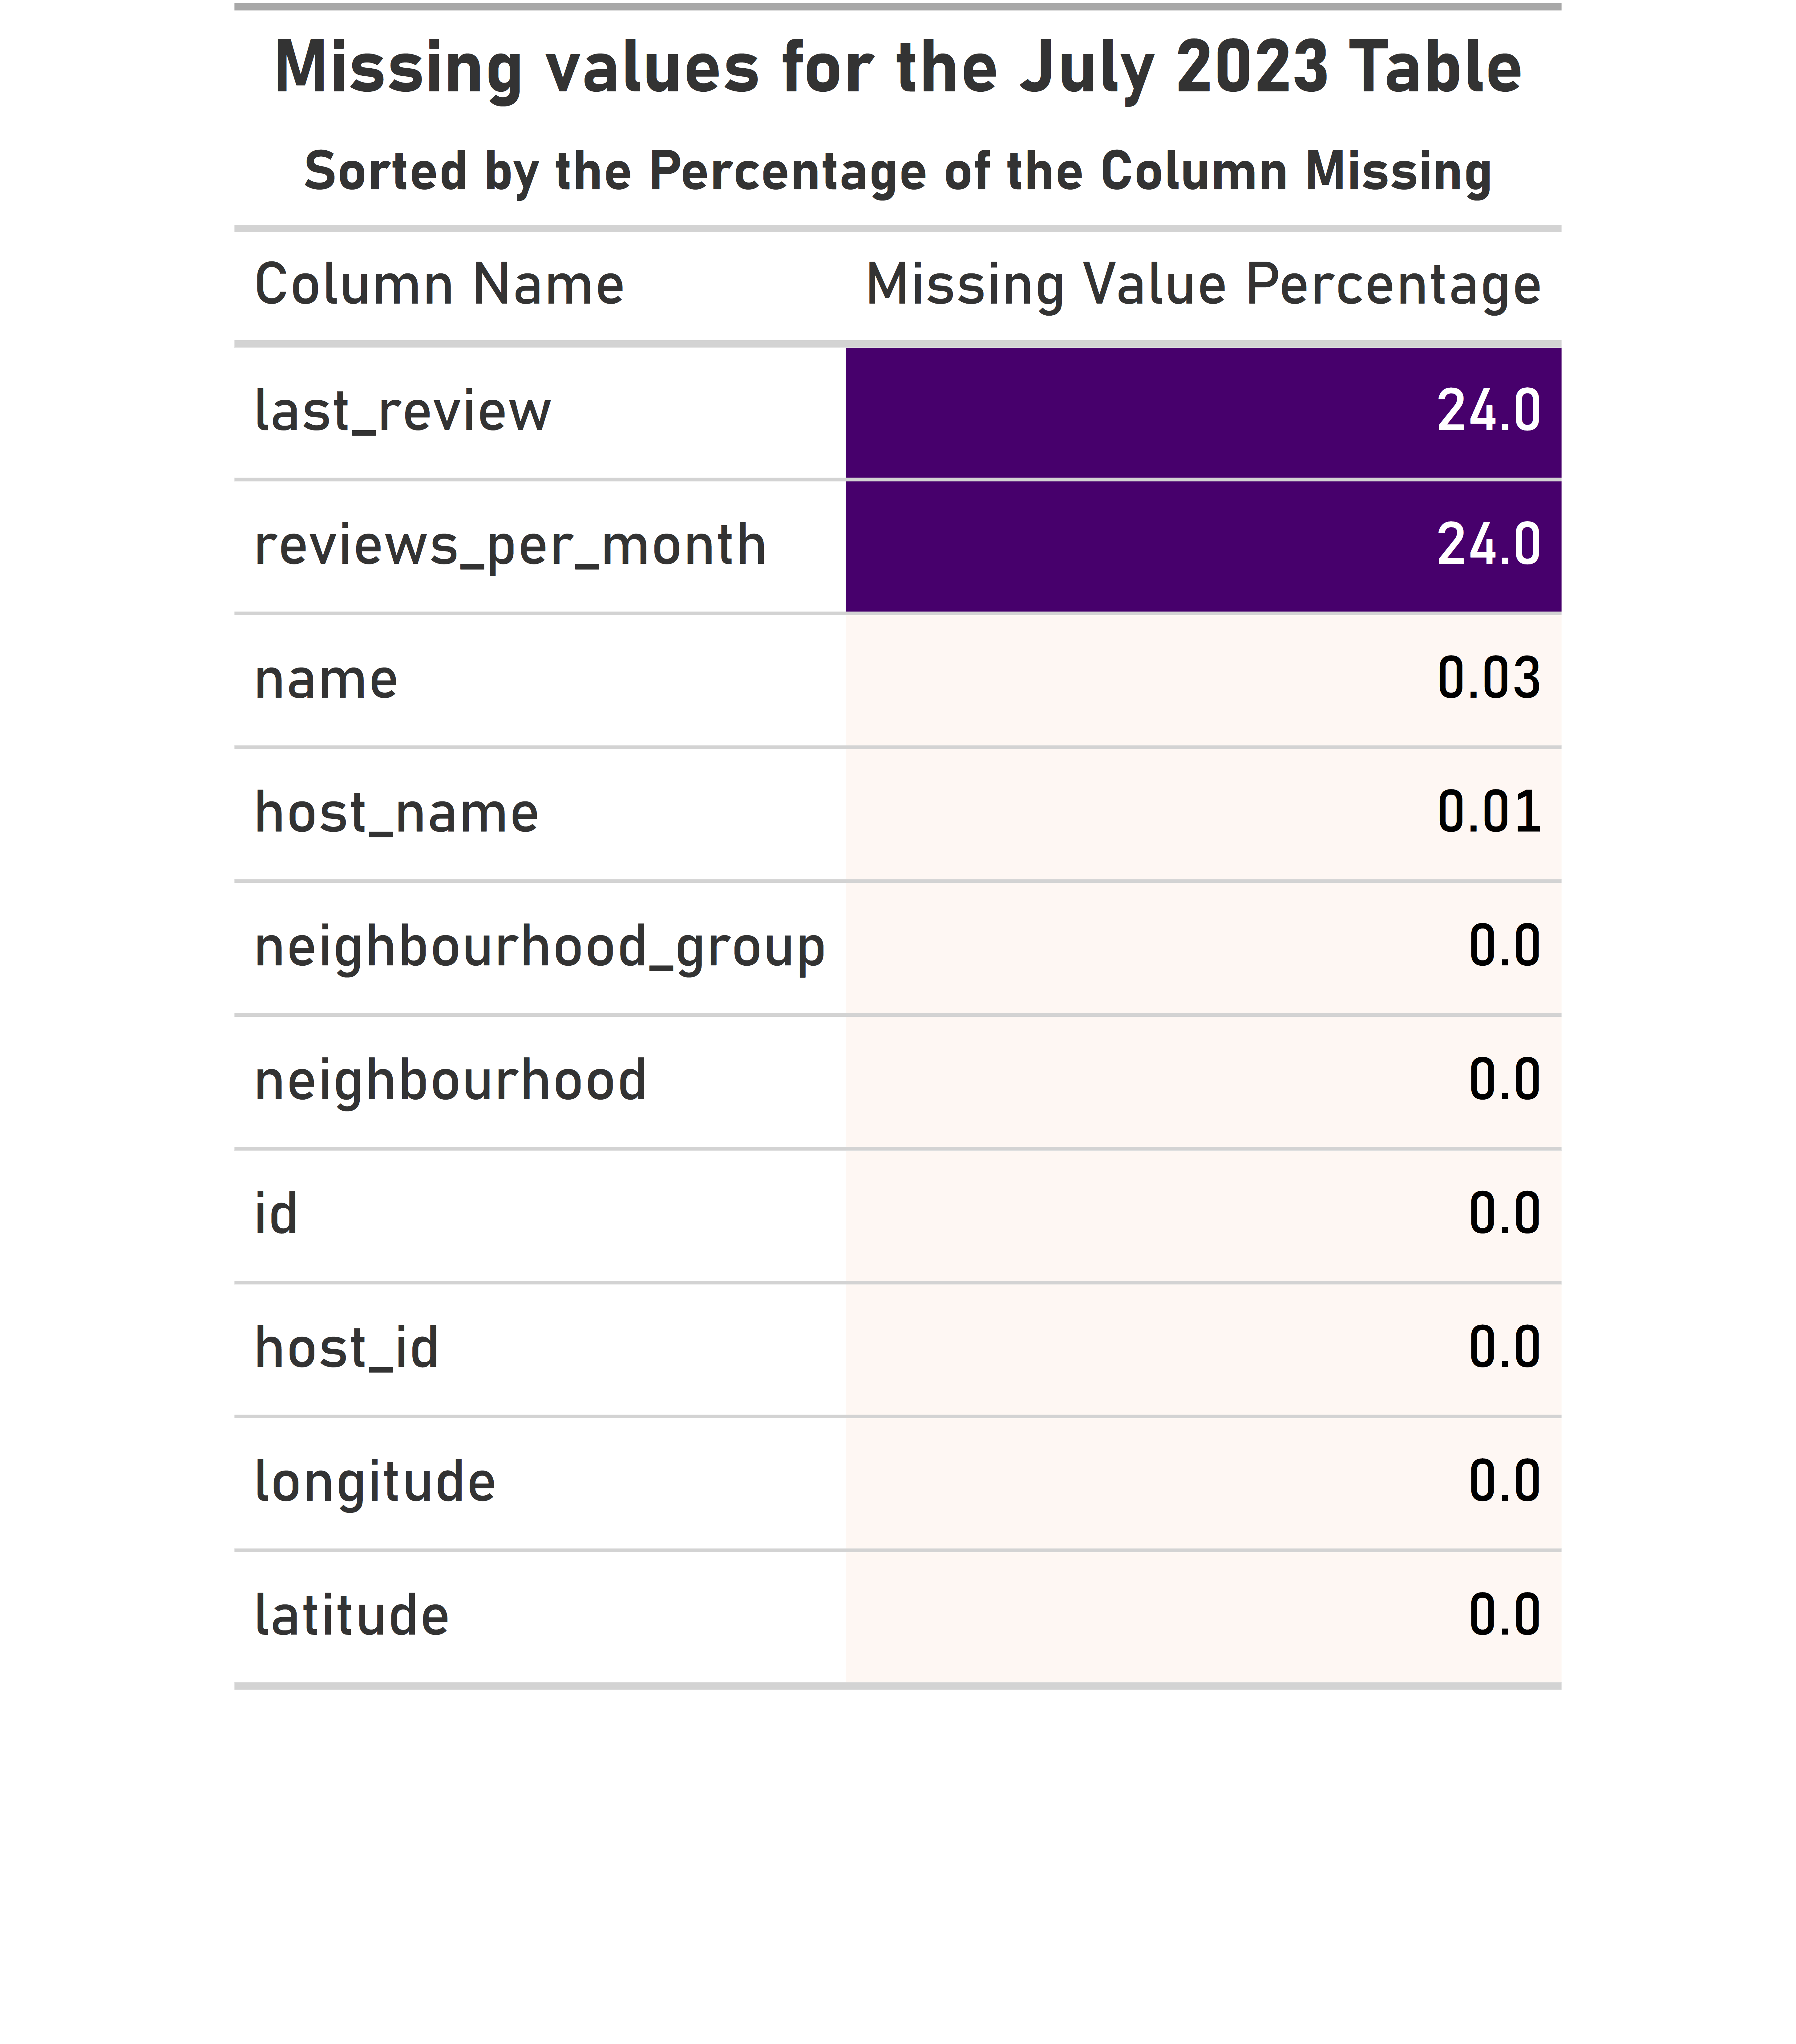
This creates an interesting dilemma; we can definitely drop calendar_updated, but what about the columns that have a noticeable proportion of their values missing? We can fill them in based upon the median, that is pretty easy, but I wanted to take a different approach given that I am taking a geography-centered point of view for this project: fill them based upon the median for that column within their borough. I think this can create a more accurate view without getting so specific that we are filling them based upon similar values in their neighborhood (which might have only a handful of values).
To do that, I created a function that takes in a DataFrame, a column to find the median for, and a column to group the DataFrame by. The function then groups by the specified column, finds the median for that column, and then fills in all the missing values just as we discussed above. I then apply that to every column within all numeric columns that have at least 30% of their values missing.
missing_columns = [name for name, val in (nov_listings.isna().sum().sort_values(ascending=False) / len(nov_listings.index) * 100).items() if val > .3 and is_numeric_dtype(nov_listings[name])]

def fill_na_with_group_means(df: pd.DataFrame, col: str, group_col: str = 'neighbourhood_group_cleansed') -> pd.Series:
    """ Returns a dictionary with the median for the grouped column that can be used to fill NaN values

    Args:
        df (pd.DataFrame): dataframe to utilize
        col (str): column to take the median of
        group_col (str, optional): column to group by Defaults to 'neighbourhood_group_cleansed'.

    Returns:
        pd.Series: series with the indexes as the grouped_by indexes and the values as the medians of each group for the specified column
    """
    # print(df.groupby(group_col)[col].transform('median'))
    return df[col].fillna(df.groupby(group_col)[col].transform('median'))

# Do it for every missing column
for col in missing_columns:
    nov_listings[col] = fill_na_with_group_means(nov_listings, col)
Step Two: Visualizations
Much of the code behind the visualizations are quite verbose, so I won’t include them in this post, but I will walk through my thought process for including each one.
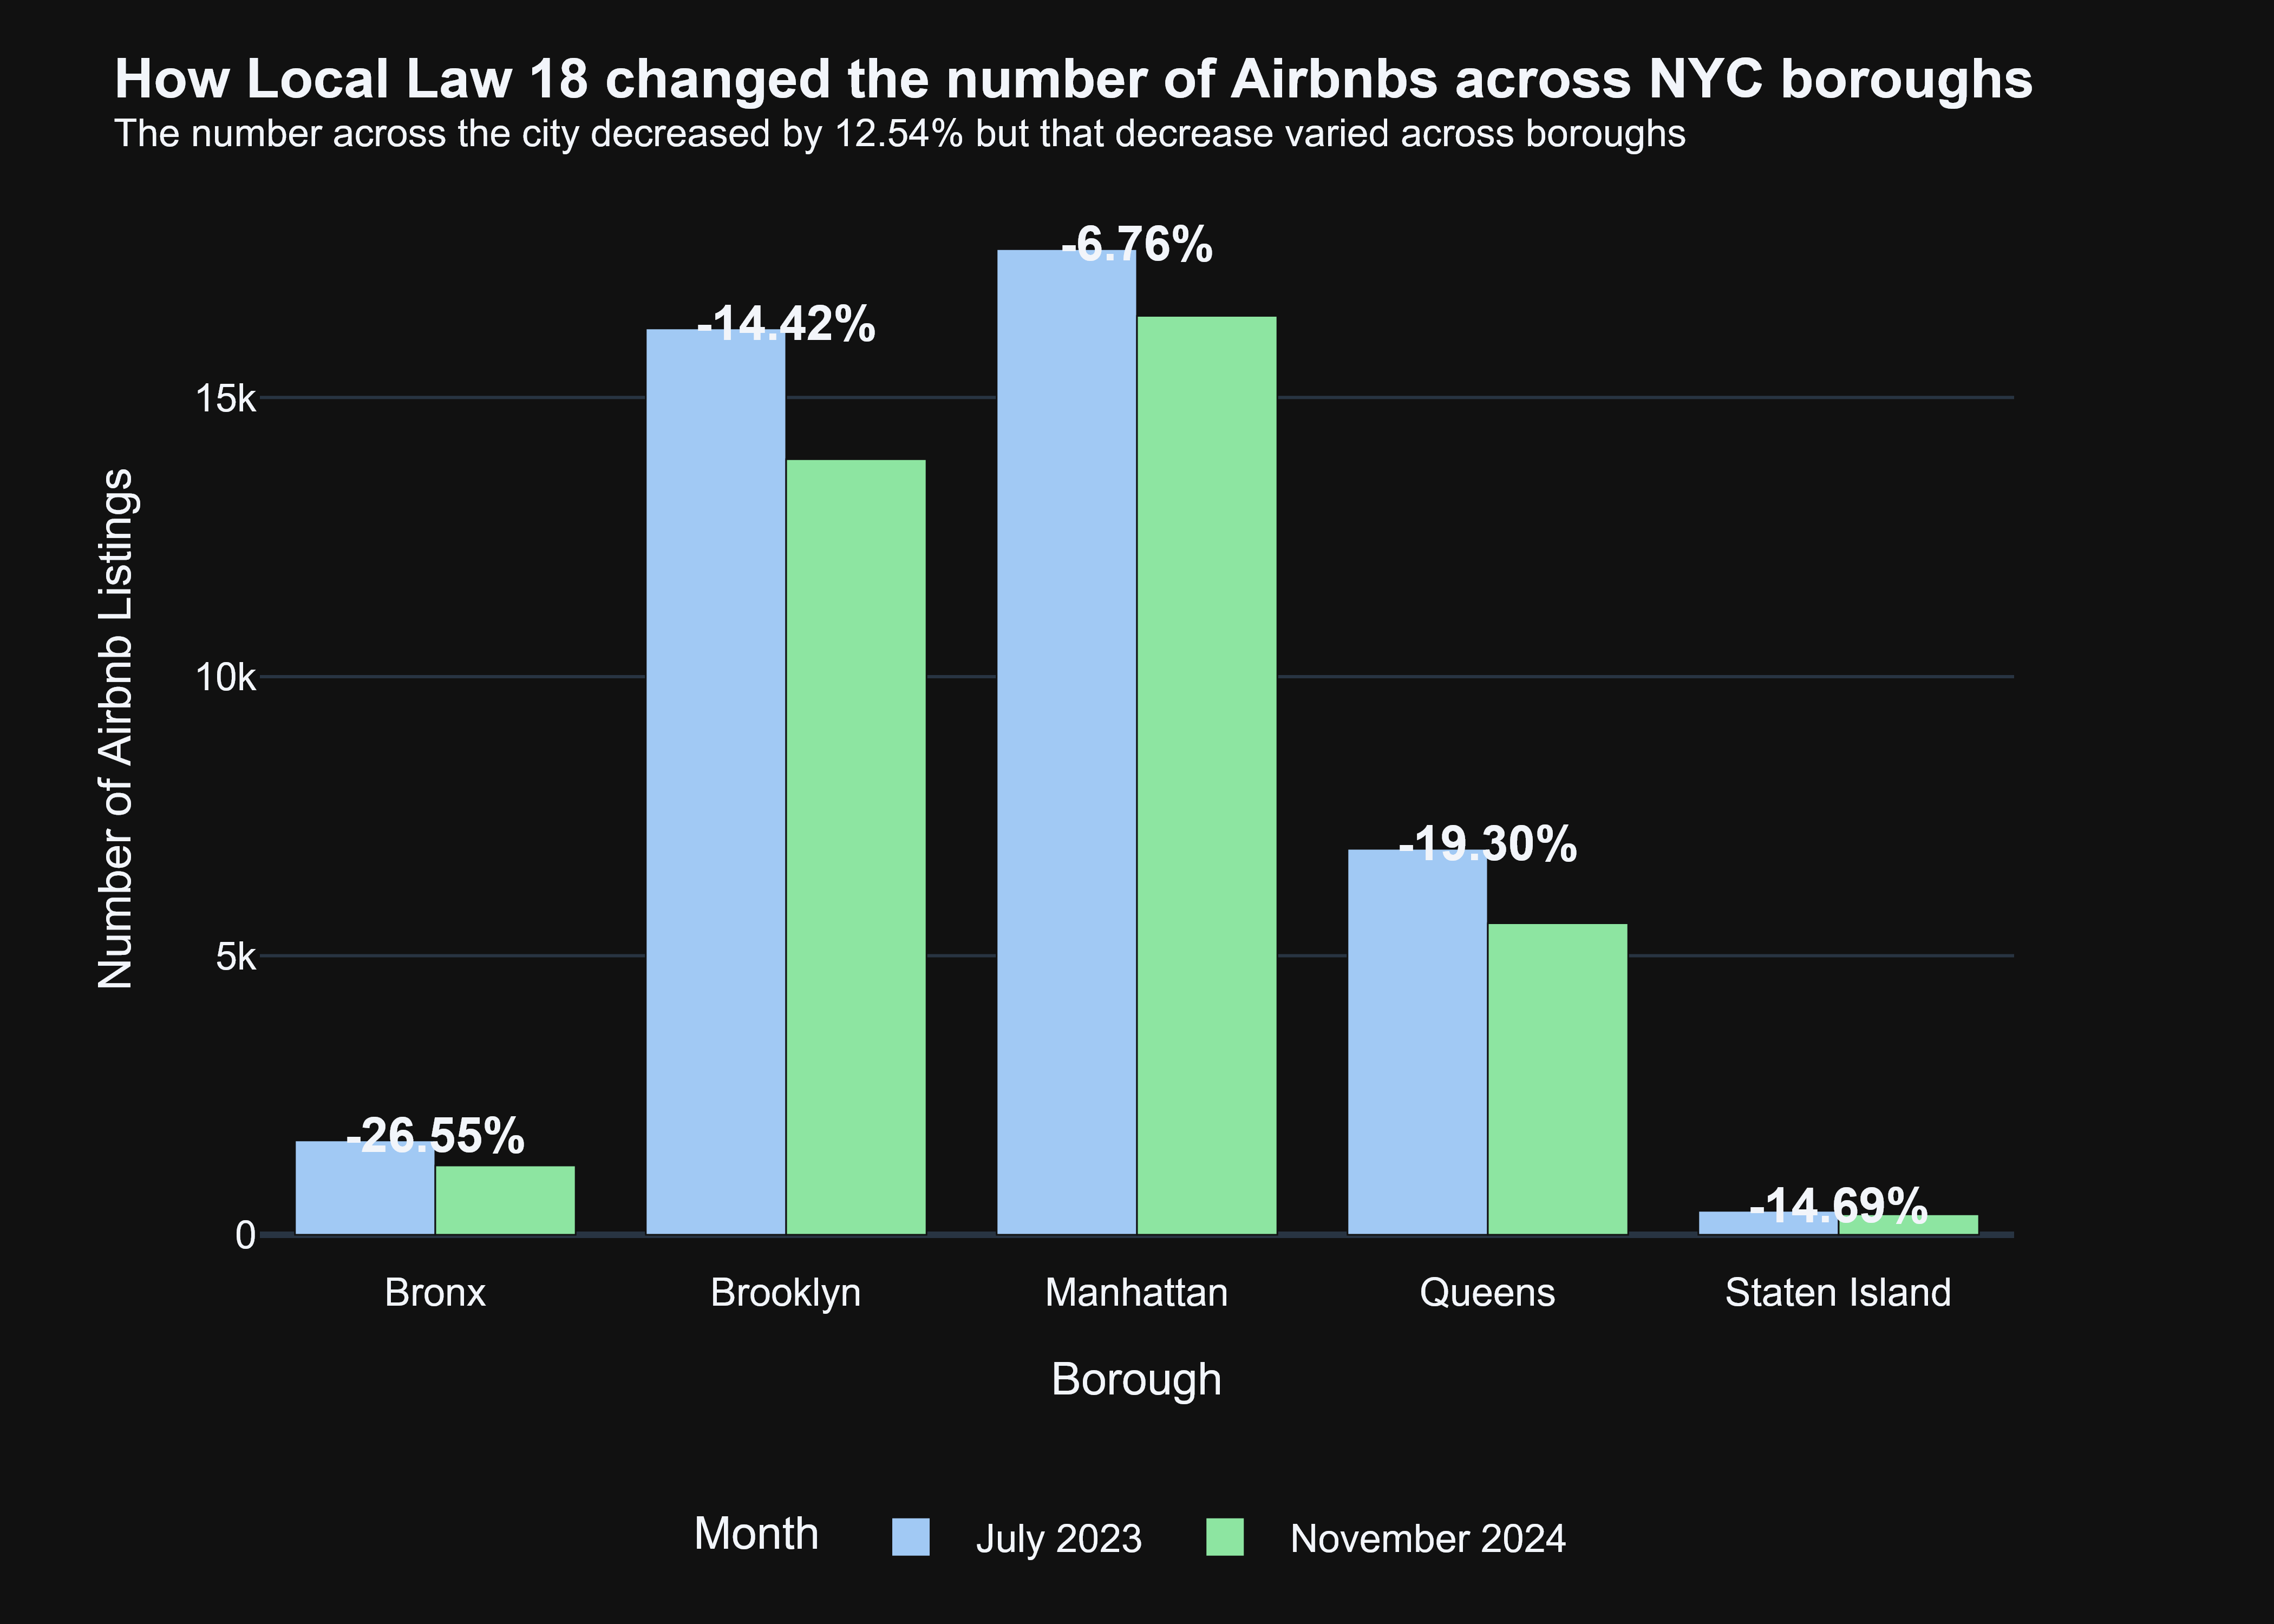
First, one of the major consequences of Local Law 18 was that it many thought that it significantly decrease the number of Airbnbs across the city, and based upon the visualization below, that certainly looks like the case.
To gain a better sense of how this spread looks through the city, you can explore the interactive maps below, with July on the left and November on the right (generated very easily through plotly!).
That’s some pretty cool insight, and helps us answer one of our initial questions, what is the current homestay market in each borough. However, the number of boroughs doesn’t simply tell the entire story. How about their average prices? Let’s explore that!
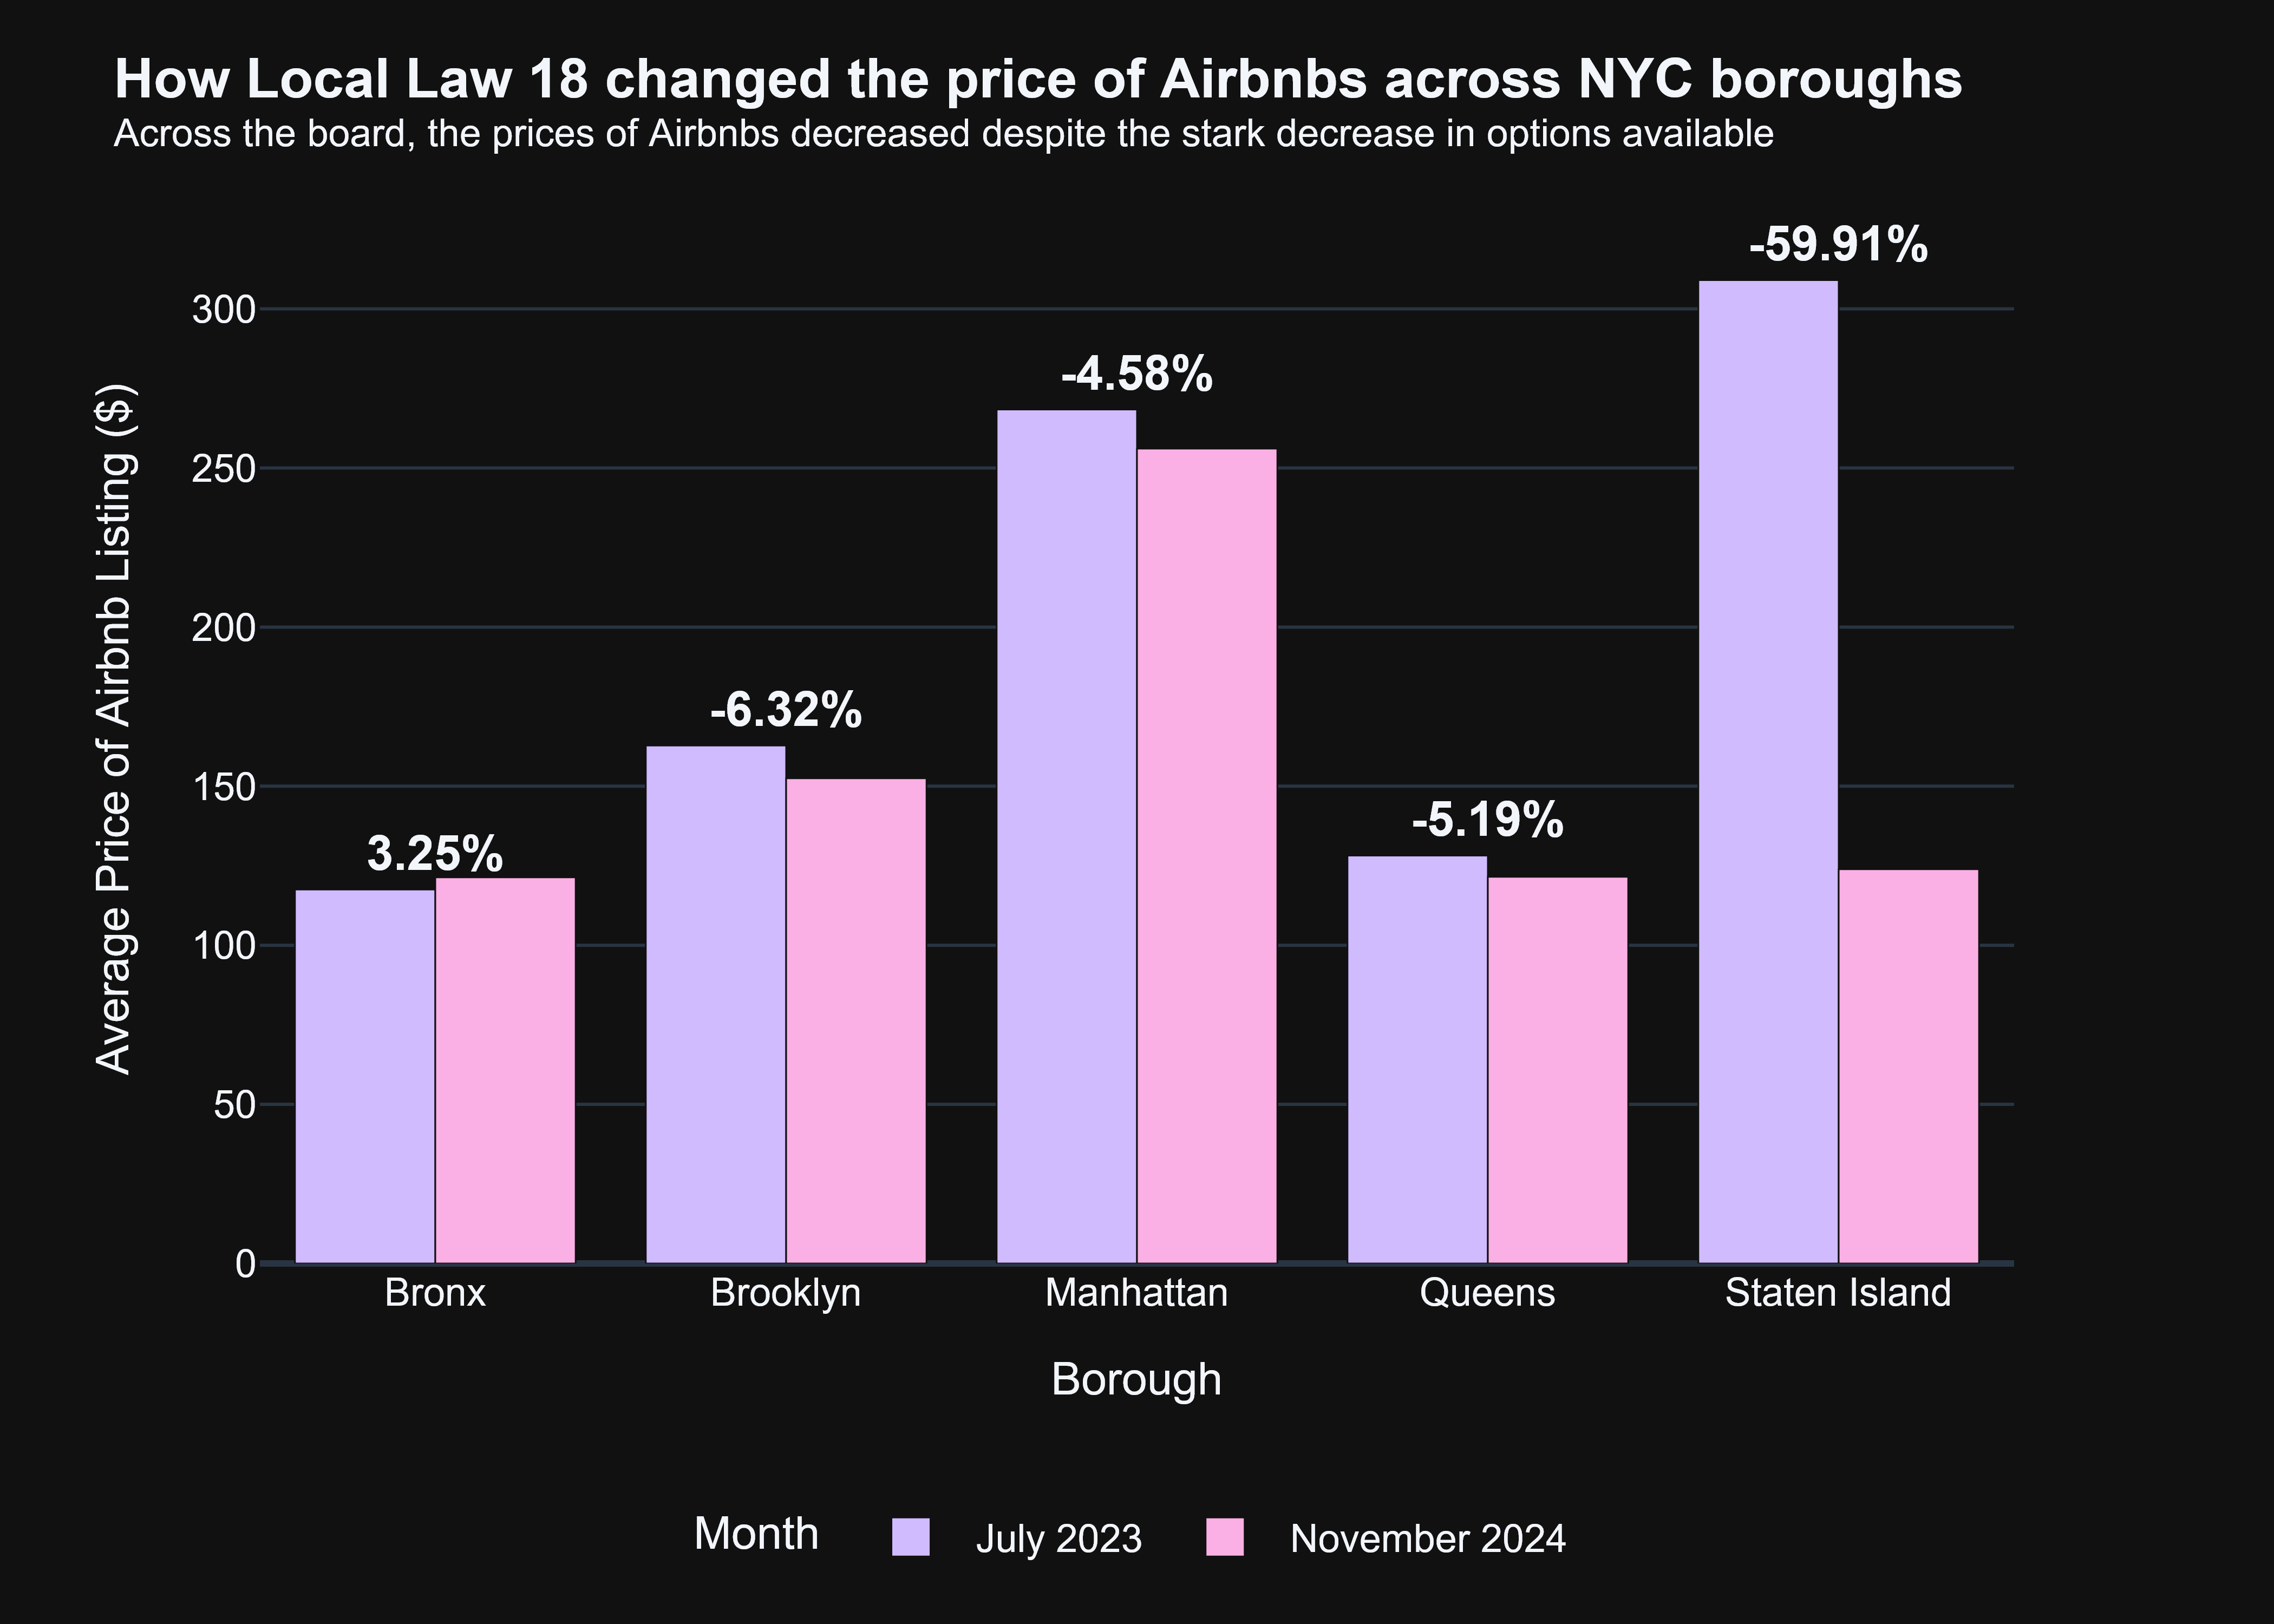
That’s really interesting! We would believe that if listings have decreased, then the demand for homestays would have rapidly increased, thus driving up the prices. However, almost each borough experienced drops in their price, outside of the Bronx—which we know from our previous visualization experienced the worse of the listings drop.
So that begs the question, why? Amid decreasing supply, why has the price dropped (which goes against the very basic economic principles I know)? Sure, we can maybe cite some external factors, such as a decrease in homestay demand or the shifting of consumers to hotels, but the latter seems unlikely given hotel prices actually skyrocketed following the implementation of the law [4].
To be honest, I don’t know for sure, I am just a guy trying to complete his project for a class. But, I can make one last visualization that can maybe help us dissect the root cause behind this rather perplexing phenomenon. I used September 2020 Airbnb data (which I only utilized one column, so there wasn’t much data pre-processing really needed).
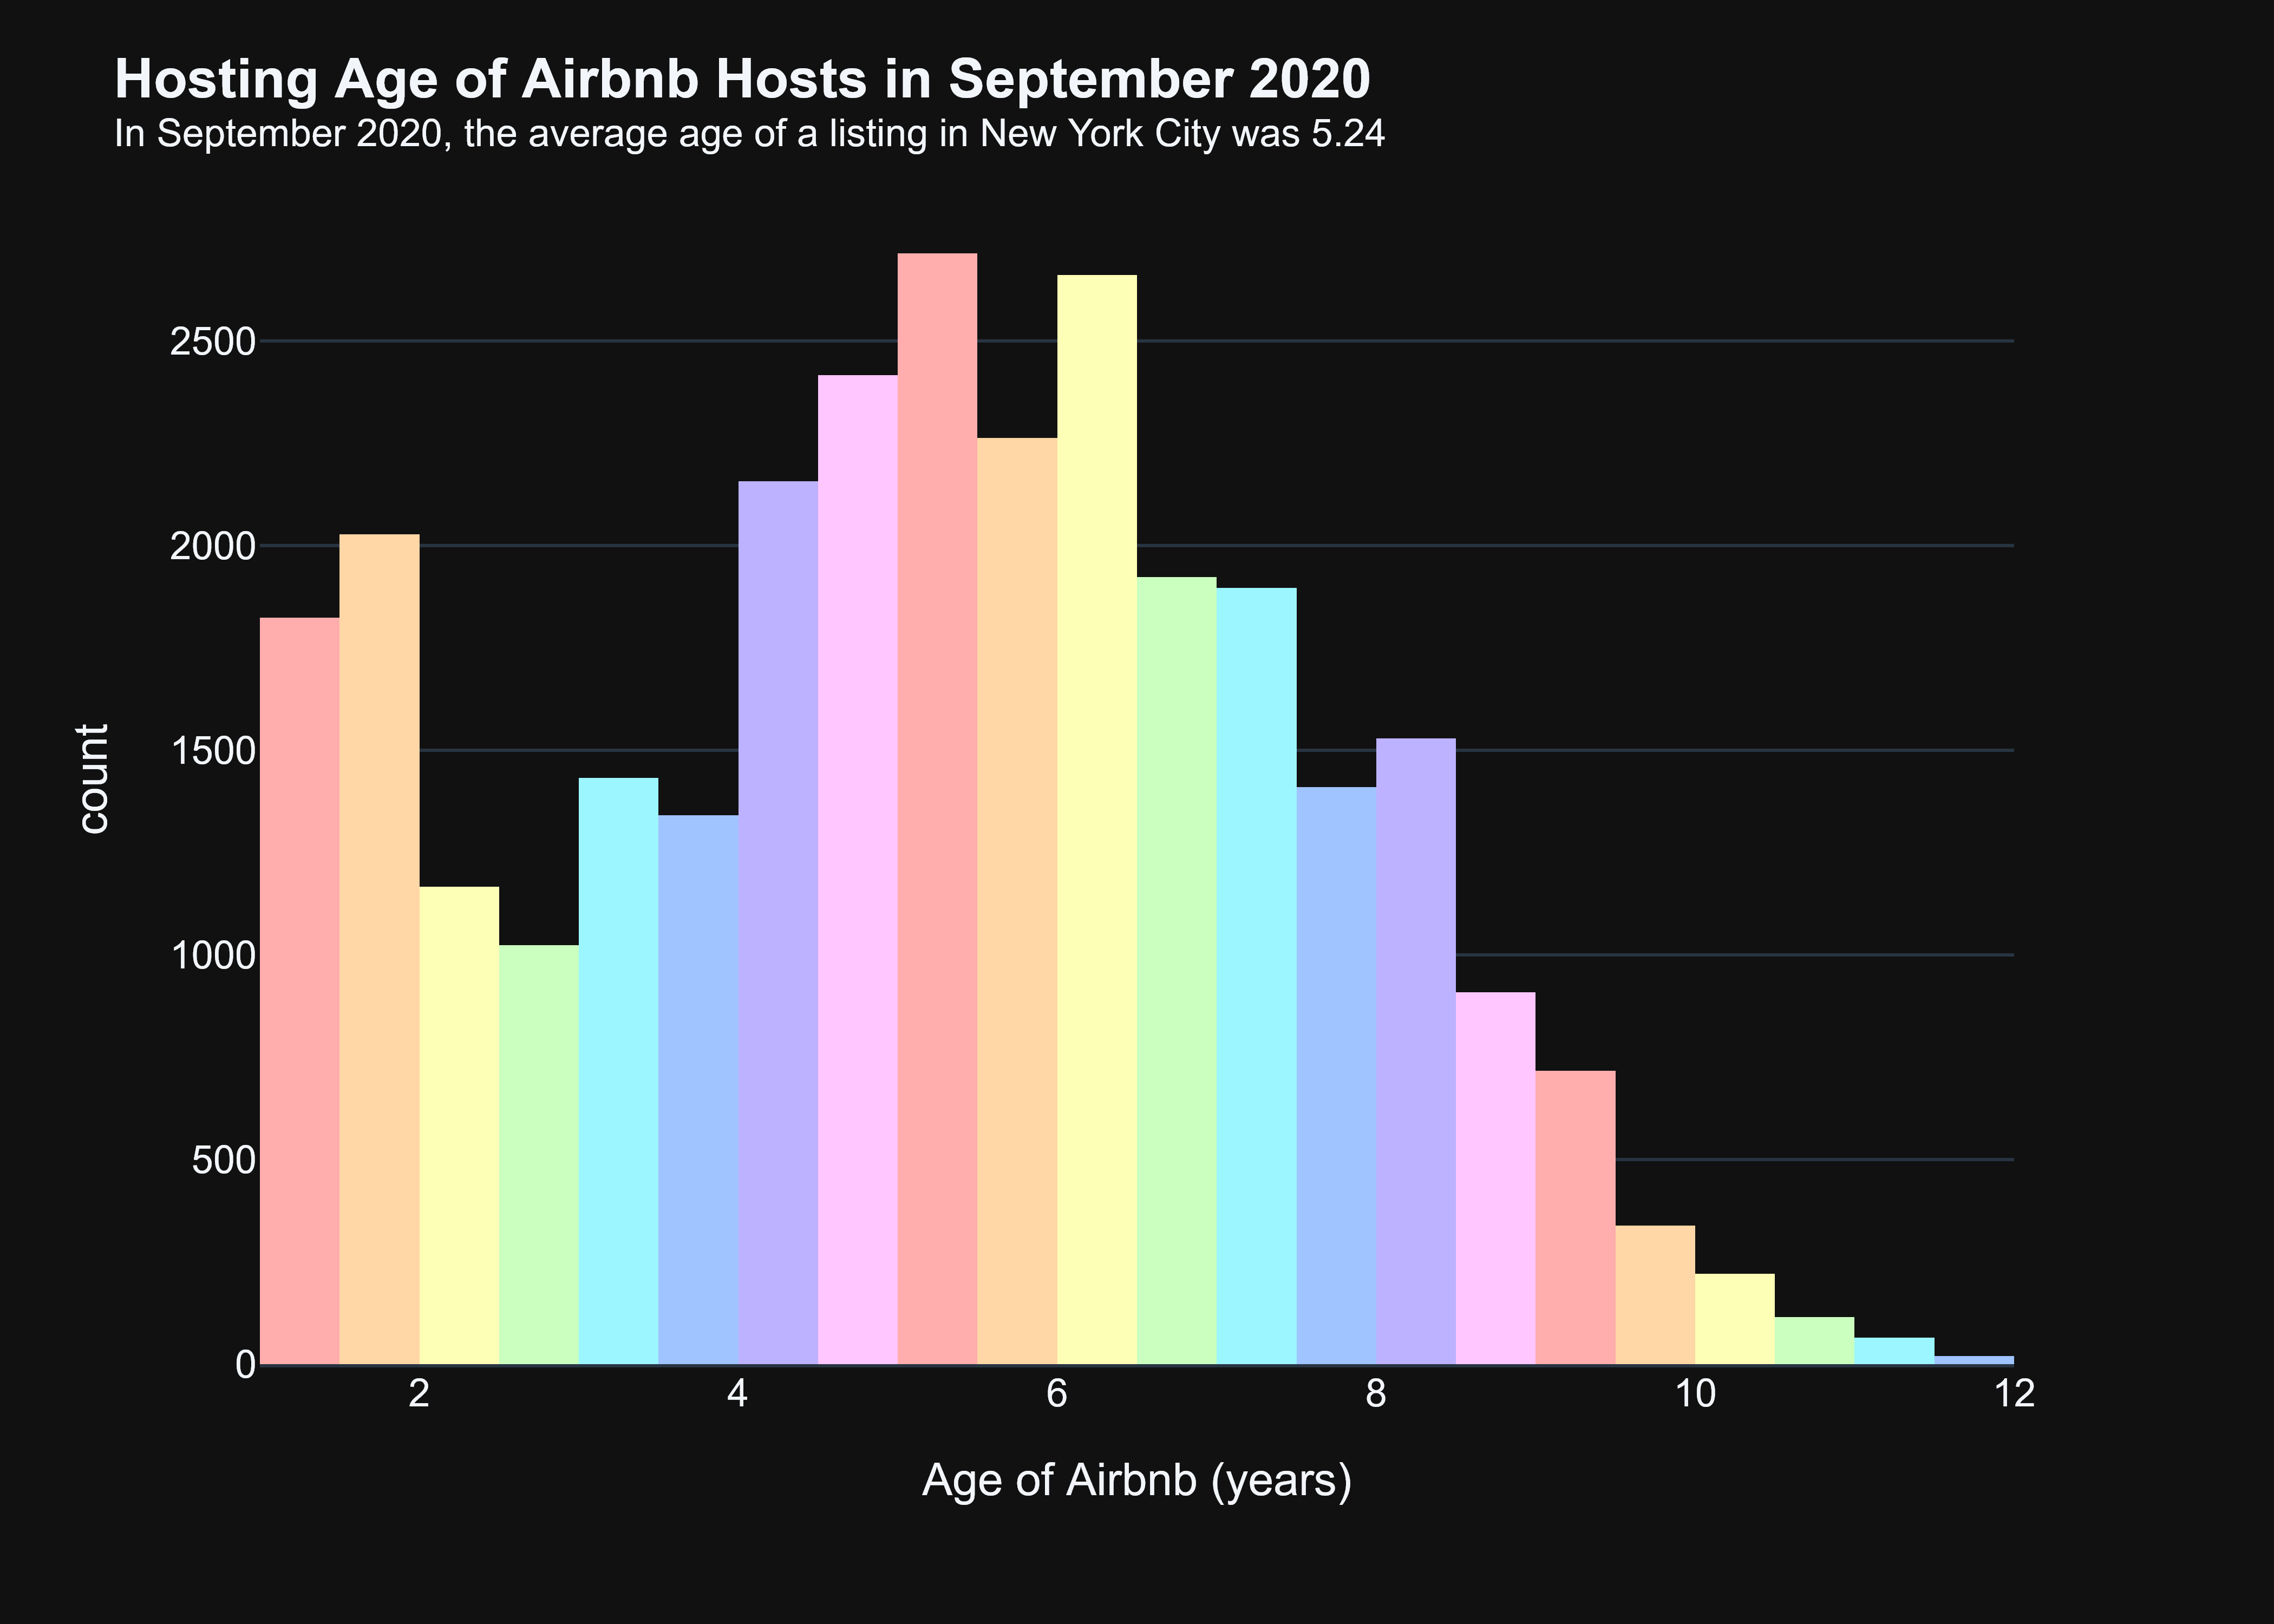
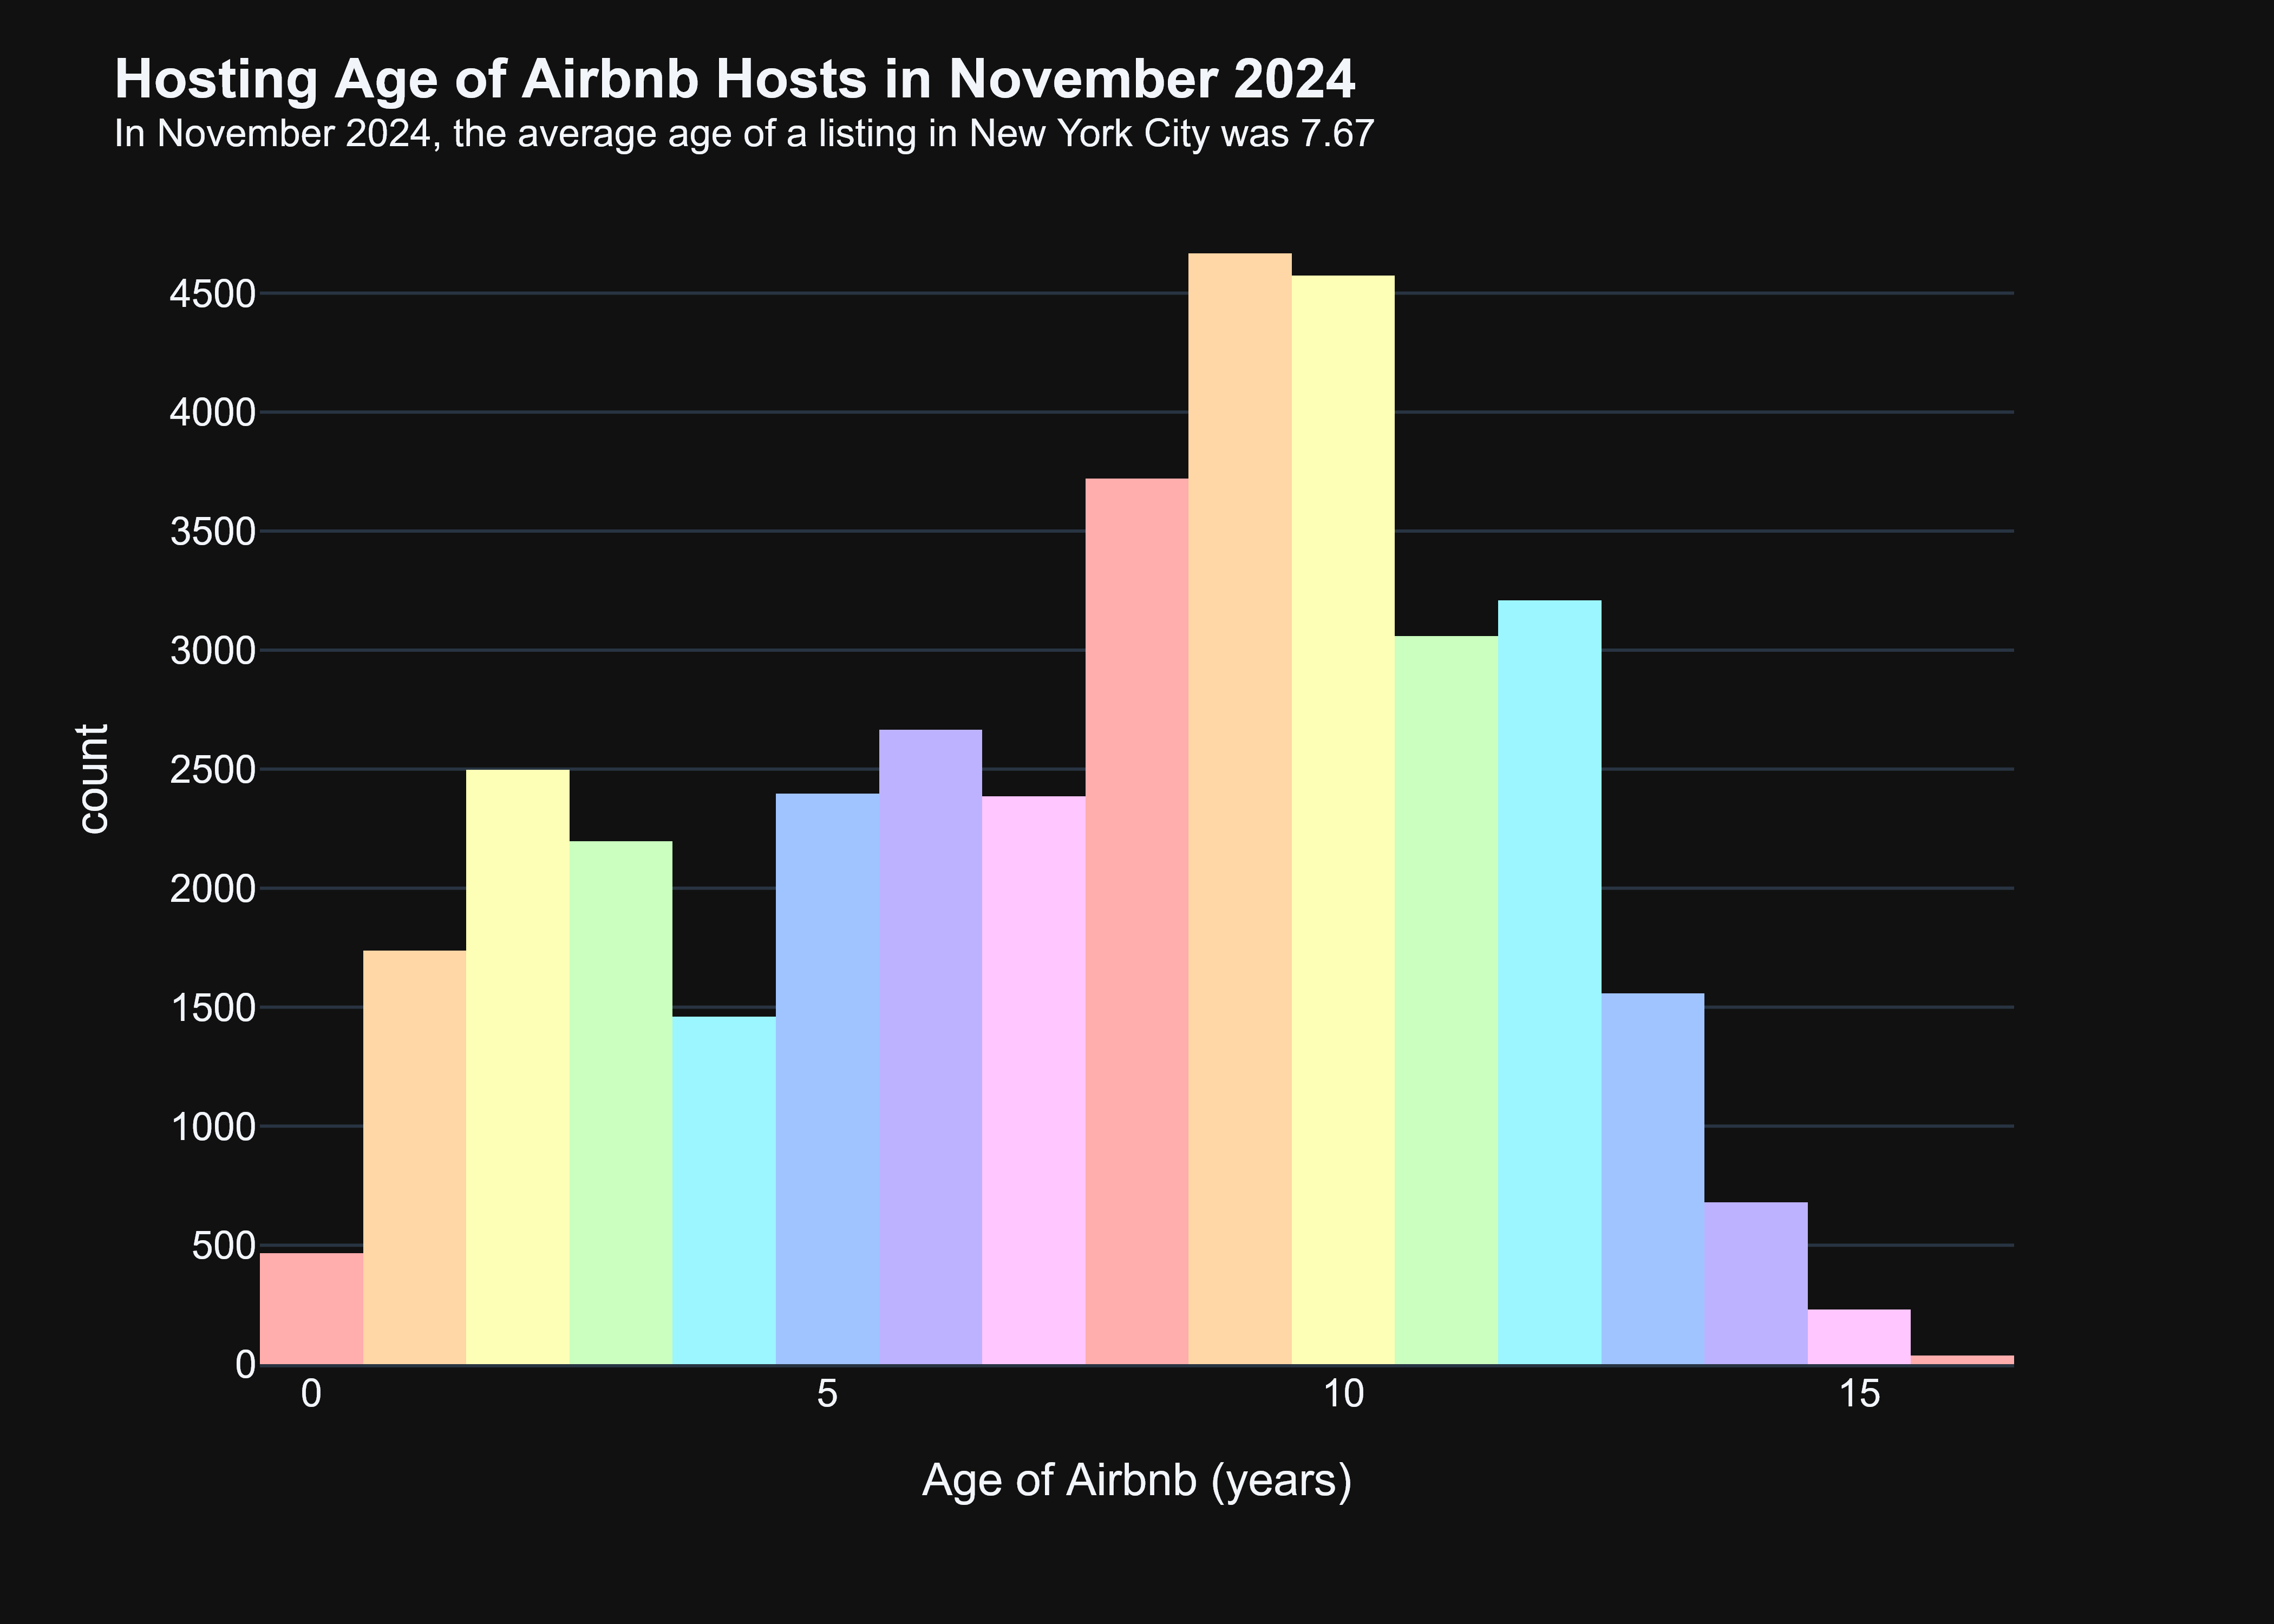
So, we can see over the course of 4 years, the ages of each Airbnb in New York City drastically changed. In September 2020, the ages are skewed right, with a notable percentage of the houses being less than 5 years old. However, in 2024, we get a distribution that is much more symmetric (or even slightly left-skewed). So, the age compositions of Airbnbs over this time frame got much older. Why does that matter? Well a massive part of Local Law 18 was trying to prevent superhosts from snatching up much of the housing market and converting them into Airbnbs. We can maybe hypothesize when Local Law 18 was passed, these superhosts realized the commitment to maintain their properties is far too costly, thus leading them to abandon their enterprise. Thus, the options available were limited to those that actually lived in the city, which typically have more modest abodes—explaining the trend we saw in the previous chart!
Conclusion
Regardless of the consequences we saw Local Law 18 cause across New York City, homestays are here to “stay” (please feel free to laugh); not just in New York but across the world. Thus, learning how these pieces of legislation are influencing one of the world’s largest metropolitan areas and provide an innumerable amount of guidance to countless other urban developments.